Using the app
Chart
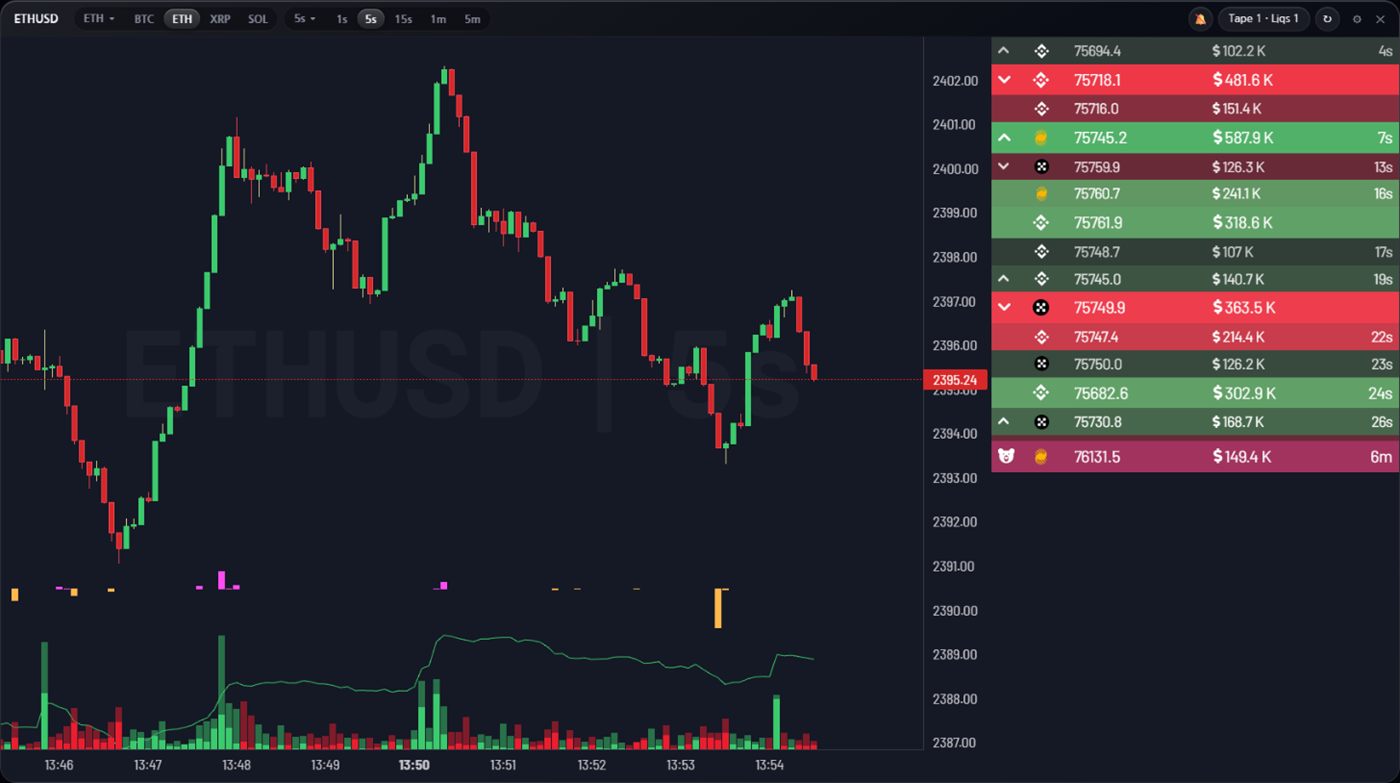
The chart builds candles directly from live exchange trade streams, which is why it can go down to one second. Sub-minute resolution is the single most common reason futures traders pay for a charting plan; here it is simply part of the terminal.
What “aggregated” means here
A candle is not taken from one venue. Trades from the markets selected for that coin are merged into a single series, so a wick reflects what actually happened across the market rather than on whichever exchange you happened to pick.
The chart is a fork of the open-source aggr chart, embedded in the terminal and wired to the same controls as the rest of the app.
Choosing a symbol
The panel header starts with the current symbol, followed by your starred shortcuts. The first chip opens the full list, where you can add a coin by ticker. Starring a coin puts it in the header for one-click switching.
Switching symbol re-subscribes in place — no reload, no configuration file.
Intervals
The header carries 1s, 5s, 15s, 1m and
5m. The dropdown holds the full range of time and tick intervals, and accepts
custom entries such as 45s, 2h or 100t.
At one second, an illiquid symbol will show gaps simply because nothing traded. That is the data being honest, not the chart failing.
Significant trades and REKTS
Beside the candles run two feeds: large prints, and the REKTS liquidation tape. Keeping them next to price means a sudden wick usually has its explanation on the same screen — a block trade, or a run of forced closes.
Chart settings
The gear on the chart panel opens the chart’s own options: audio filters, which exchanges feed the series, display and colour choices. Audio here is separate from alarm sounds, but the global mute in the top bar silences both.
The chart derives from aggr, which is GPL-3.0. The modified source is published — see the open source licences entry in Settings.