Using the app
Liquidations
Four widgets answer four different questions about the same forced selling: who is being closed out right now, which symbols are taking the damage, how much has happened over various windows, and whether today is large by historical standards.
Binance, OKX, Bybit and Bitget are aggregated into one feed. Hyperliquid coverage is partial today. Bitget publishes at most one liquidation per symbol and side per second, so its share is understated rather than complete.
Real-Time Liquidations
This widget answers the most immediate question: is anything happening right now? It is the one most people leave running, because a cascade appears here first as a change of rhythm — the tape speeding up, the sizes growing — while the same event is still a single unremarkable candle on a chart.
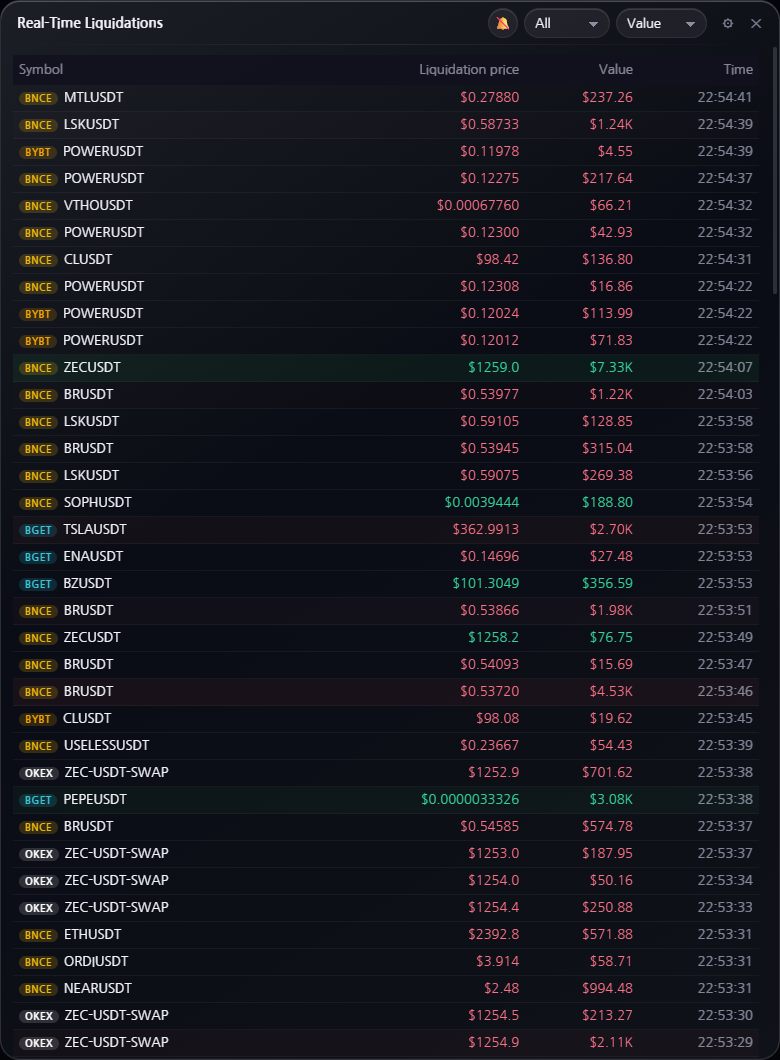
The tape runs newest first. The coloured tag on the left is the venue. Liquidation price is the price the position was closed at, not the mark price.
The header controls let you narrow what arrives:
- Exchange filter — all venues, or one at a time.
- Minimum value — hide the noise and keep only sizeable liquidations.
- Sound — the bell icon plays a tone on qualifying liquidations. Long and short can use different sounds.
Liquidation Heatmap
The tape tells you that forced selling is happening, not where it is concentrated. The heatmap answers that by laying the whole window out on one surface, so one symbol taking the damage looks nothing like the entire market going at once.
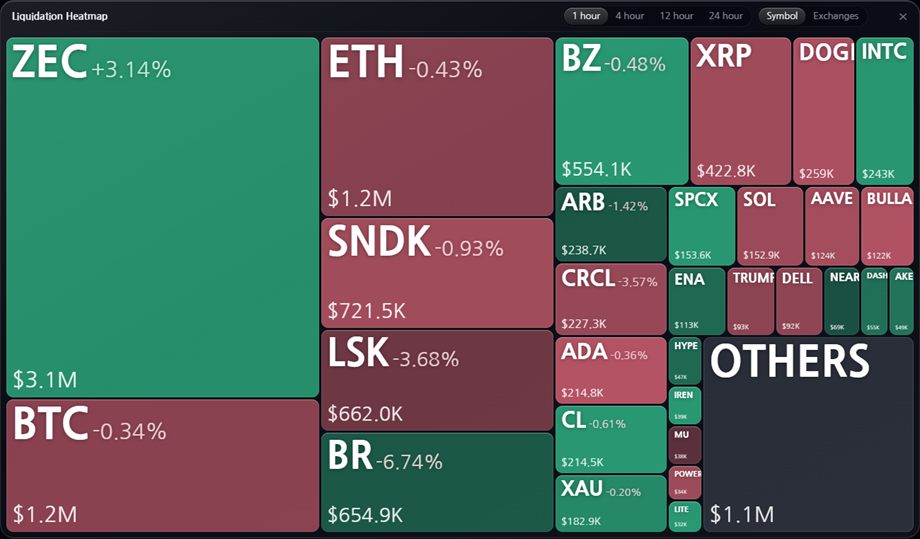
Each tile is a symbol, sized by how much was liquidated over the selected window (1 hour, 4 hour, 12 hour or 24 hour). Everything too small to render collapses into OTHERS.
Long liquidations render red and short liquidations green, matching the chart’s colour language: red means longs are being forced out. The percentage on each tile is that coin’s price change over the same window you selected, not a fixed 24 hours.
The Symbol / Exchanges toggle switches between grouping by coin and grouping by venue.
Total Liquidations
A number on its own means little; what it needs is a reference point. This widget supplies one by showing the same market over six windows at once, so you can see whether the last five minutes is an ordinary slice of the day or nearly all of it.
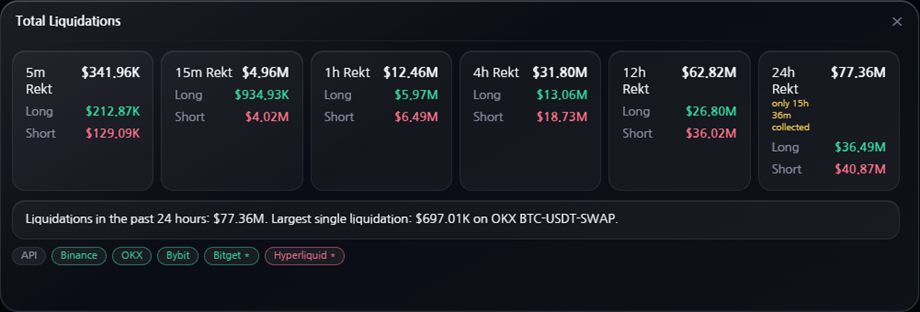
The imbalance between long and short is the useful part. A move fed by longs being closed reads very differently from the same move with shorts being squeezed.
If the API has been collecting for less time than a window covers, the tile says so (for example only 15h 20m collected) instead of presenting an incomplete figure as a full day.
Top 10 Liquidation Events vs Now
The widest frame of the four. Every window above is at most a day long, which cannot tell you whether the day itself is large. This one places the running 24-hour total beside the biggest liquidation events on record — the difference between a busy afternoon and a day people will still be naming years from now.
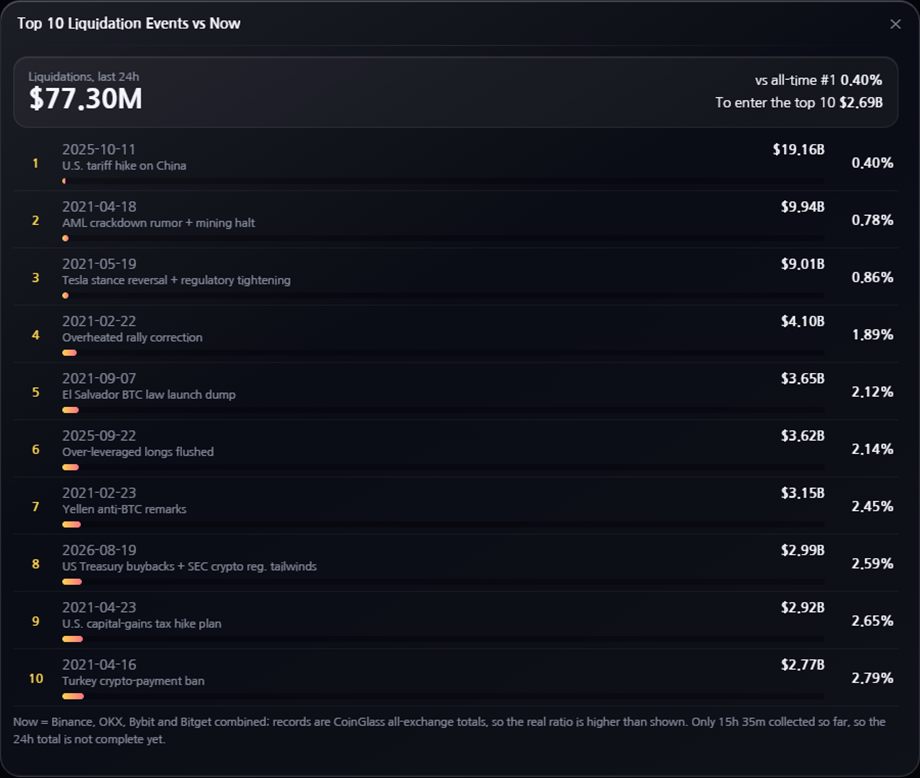
The header shows your rolling 24-hour total, what percentage of the all-time number one that represents, and how much more would be needed to enter the top ten. The list below is the record, largest first.
The historical records are all-exchange totals, while the live figure counts Binance, OKX, Bybit and Bitget. The real ratio is therefore higher than the percentage shown. The widget states this rather than flattering its own number.
The record list is maintained on the server, so it stays correct without an app update. If it has not been filled in, the widget shows the current 24-hour figure alone rather than inventing history.
Related
Liquidation volume is also one half of the cascade alert; the other half is how many symbols are dislocating at once, which comes from the mark-price gap tracker.